Commentary from Governor David Patterson, New York on CNN.com:
Today, we find ourselves in the midst of a new public health epidemic: childhood obesity.
What smoking was to my parents’ generation, obesity is to my children’s generation. Nearly one out of every four New Yorkers under the age of 18 is obese. In many high-poverty areas, the rate is closer to one out of three.
That is why, in the state budget I presented last Tuesday, I proposed a tax on sugared beverages like soda. Research has demonstrated that soft-drink consumption is one of the main drivers of childhood obesity.
These days I’m no longer surprised when something like an “obesity tax” is foisted upon the masses without so much as a whimper – afterall it is your fault if you’re fat, right? You should pay more, right?
Several commentators in the media applauded the move by Governor Patterson – Nicolas Kristof opined the hope that other states will follow suit because “if other states follow, [it] could help make us healthier.”
He even ties it up neatly with a bow, repeating Patterson’s parallel to smoking and cigarettes, “These days, sugary drinks are to American health roughly what tobacco was a generation ago. A tax would shift some consumers, especially kids, to diet drinks or water.”
No one likes taxes, but by golly, we must do this for the children! We must save ourselves from ourselves with this tax – save the children, save the world, reduce consumption of sugared beverages and all will be well.
What’s maddening isn’t so much the propsed tax on sugared beverages, it is what government does if they can get away with it….what’s maddening is that no one seems to notice that we are already paying taxes that enable the flood of cheap soda, fruit drinks and sugared beverages into our markets. It’s paid by our taxes in the Farm Bill, with corn being king amongst the crops subsidized by our tax dollars.
This new tax represents a double taxation to New Yorkers – taxed first from their income to subsidize corn in the Farm Bill; and now to add insult to injury, when they dare to consume products made from the corn products their tax dollars helped make cheap at the consumer level – namely high-fructose corn syrup….beverages produced that are artificially low in price at the consumer level and often cheaper than buying a bottle of water!
If the government truly wants to tackle the obesity epidemic, perhaps it’s time to revisit the Farm Bill and how it is directly creating a market flooded with cheap corn calories at the consumer level for things like high-fructose corn syrup which is used in thousands of food products in our markets!
Friday, December 26, 2008
Tuesday, December 09, 2008
Banning Bottled Water
They say the road to hell is paved by good intentions.
The Toronto Star recently noted the political battlelines drawn around the debate to ban bottled water in Toronto, “Environmentalists claim bottled water commercializes a public resource, undermines faith in Canadian water systems, and sends plastic bottles to the landfills. The bottled water industry counters that environmental groups rig recycling rate numbers and vilify a product that helps combat obesity.”
Last week the vote was cast and the Toronto city council voted to immediately ban the sale and/or distribution of bottled water in City Hall and the city’s civic centres where contracts permit, and ban the sale and/or distribution of bottled water in other city-owned facilities such as arenas and theatres by the end of 2011.
While it’s now illegal to not only sell bottled water, but also illegal to distribute bottled water in city-owned facilities in Toronto, it’s still perfectly legal and acceptable to sell and distribute sweetened waters (translation – soda and fruit drinks).
Afterall, isn’t that really what soda and fruit drinks are – simply sweetened water?
Let me see if I understand this.
Bottled water = bad-illegal
Bottled soda & fruit drinks = good-legal
This vote after Statistics Canada released data that found Canadians consumed more than 95 litres of soft drinks in 2007!
How much more soda and fruit drinks do you think folks will drink now that bottled water is banned?
Friday, October 17, 2008
So We Begin the Food Stamp Challenge
When I posted about this year’s Food Stamp Challenge yesterday, underway in various locations in the US, I assumed it was going to be much harder this year to stay within the allotted budget despite an almost double amount of money last year. My regular readers may recall, last year I reviewed the sales circulars online to get the best bargains, planned the week of meals before I went shopping, had to include a fairly high level of canned goods (especially beans) and barely made the budget. We did well nutritionally – with the exception of Vitamin D, we met all nutrient requirement RDA’s and managed to keep carbohydrate intake at an average 97g per day for the week; 73g net if you deduct fiber. But, as I noted, it wasn’t easy to do on a budget of just $3.00 per person per day, or $63 for the week for my family.
This year, with a nearly double budget – $123.27 for the week ($5.87 per person per day) – I changed the rules I’d follow in response to comments last year. Unlike last year, this year I’d shop in only one store, no pre-planning; instead I’d grab a sales circular on my way into the closest grocery store to my home and do my shopping for the week without any menus planned ahead of time.
Now I don’t shop for many routine items at the grocery store – most meats for us are usually ordered from a local farm, I buy a lot of produce at the local Farmer’s Market, and some things, like cheese, I usually buy at a specialty shop in town. But I do shop enough in the grocery stores to note that prices have definitely risen over the last year, with some items nearly double what I remember from last year.
When I did our grocery shopping yesterday, at HyVee (closest to my house) I was surprised that I wasn’t just within budget, but that I didn’t spend the entire budget. And, I included a number of items that were “maybe” items, held back until I could see the running total for the “must have” foods; “maybe” things like crumbled blue cheese, roasted red pepper hummus, name-brand coffee, a small container of heavy cream, a fancy brand of fajita wraps and a small pumpkin my son asked for that we aren’t going to actually eat.
That isn’t to say I didn’t make any compromises – I did buy canned green beans over the fresh, they were much less expensive in the can; I chose frozen whole strawberries over the fresh for the same reason; and frozen broccoli won over the fresh too. My cuts of meat, poultry and fish were all selected by price rather than higher priced selections. For the most part, organic foods were out….one compromise I would not make was the organic, grass-fed, VAT pasturized, non-homogenized milk for my son; that was one thing that would be included no matter how much it cost. Luck had it though that it was on sale this week!
I also decided once I saw the sale circular for the week, that I’d see if I could do a week with low-carb – basically keep carbohydrate (for my husband and I only) at or below 60g a day on average and not have to include much in the way of beans or starchy foods, although I did buy two bread items (wraps and pita) when I saw they were possible within the budget. My goal again this year is that in the week we are able to eat well and meet our nutrient requirements. I think I did fairly well too!
When all was totaled, I spent $115.55 before tax, $120.91 with tax.
What did I get for my money?
*Items with a star were “maybe” items included when I saw the total was still within budget, listed in order placed into the final order.
1-pound butter
3-quarts half & half
2 dozen large eggs
1/2 gallon organic whole milk
1 8-ounce brick store-brand mozzarella
1 8-ounce brick store-brand cheddar
1 container sour cream
1 container cottage cheese
1 package cream cheese
10 8-ounce containers assorted store-brand yogurt (including plain)
1-pound deli ham (it was a steal at $1.99 a pound!)
1-pound bag frozen broccoli
1-pound bag frozen spinach
1-pound bag frozen whole strawberries
Box of tea bags
1 can bean sprouts
2 cans green beans
Small Hellmann’s mayonnaise
2 Bottles store-brand salad dressing
1 small bottle soy sauce
2 cans mandarin oranges
1 bag dried split peas
1 packet taco seasoning
1 can tomato paste
1 can diced tomatoes
1 bag sauerkraut
5 bananas bunch
2 pears
1 head cauliflower
2 cucumbers
2 bags of store-brand mixed salad
1 head iceberg lettuce
2 kiwi fruit
1 yellow pepper
2 red peppers
2 green peppers
Yellow and green squash
1 spaghetti squash
2.5-pounds carrots
1 package Wholly guacamole
4 lemons
5 onions
1/2 cantaloupe
5 apples
2 plums
1 package Johnsonville sausage patties
1 package Oscar Mayer bacon
1 whole chicken
1 package chicken leg/thigh quarters
1 package split chicken breasts
2 pounds ground beef
1 large pork roast
1 package coconut crusted fish filets (store made; raw; frozen)
1 package eye-of-round steak
Folgers coffee* (I had a smaller, less expensive container, but added this instead)
1 package boneless skinless chicken breasts*
1/2 pint heavy cream*
1 small bottle olive oil*
1 small jar minced garlic*
Assorted bags, very small amounts, open/loose spices sold by the ounce*
1 container blue cheese crumbles*
3 small sample size cheese (butterkase, gouda, gruyere)*
1 container roasted red pepper hummus*
1 5-pack Toufayan tomato wraps*
1 package pita*
1 small pumpkin*
You’ll notice that above I don’t have any tomatoes or tomato sauce. That’s because we have a garden and right now, an excess of tomatoes that have to be eaten or made into sauce, so I’ll be using those tomatoes in some dishes this week.
As you can see, I wasn’t left with little choice – I didn’t have to buy boxes of macaroni & cheese or ramen noodles. In fact, with the higher budget this year, I was able to buy much more fresh produce and meat, along with some “goodies” to enhance the meals I’ll make, like blue cheese to top salads, assorted cheeses for snacks, and decent coffee for our morning brew.
Last night we kicked off our week with a delicious chicken & beef fajitas, complete with tomato wraps, sour cream, guacamole and cheddar cheese that I shredded from the block of cheese. Since our son isn’t too keen on spicy food, I made him some plain chicken and onion sautéed in a little butter, and with that he had some broccoli and a blueberry yogurt, and then a plum for dessert.
Thursday, October 16, 2008
Food Stamp Challenge 2008
In May 2007, I decided to step up to a challenge getting a lot of press as the Congress was readying to pass a new farm bill – it was to feed my family with a budget those recieving food stamps must stay within each week.
At that time, the average per day was just $3.00 per person each day, which translated to $21 per week per person, or $63 total for all three of us to eat for one week. I chronicled my shopping, meals and my thoughts afterward between May 25 and June 5, which are still available on my blog.
Making the news this week is a new challenge as we near the holiday season and more individuals and families find themselves in need of assistance. Yesterday kicked-off the Grand Rapids for the Michigan Food Stamp Challenge where those participating try to live on $5.87 per day per person (the new, higher maximum level provided to recipients).
From news reports, “300 state and local leaders who have pledged to live on the equivalent of food stamps for five days.”
Apparently the governor of Michigan, Jennifer Granholm, is participating in the challenge. As reported by mlive.com, “The governor says she took her son shopping Sunday at a Meijer grocery store. They could only spend $5.87 per day per person. She says she bought a lot of macaroni and cheese.”
Like last year, I’m not surprised by the belief perpetuated in the media that one must eat poor quality, high carbohydrate, cheap foods to survive on a limited budget. Last year I showed that was untrue as I fed my family a high-quality, nutrient dense diet for the week on just $3.00 a day per person. This year recipients receive even more money and I have to wonder, given the current economic situation, is the increase enough or not?
So this year, once again, I’m going to see what a food stamp budget, $5.87 per person per day, buys us since food prices have steadily increased in the last year.
Can we eat as well as we did last year?
Will I need to make compromises?
Will we eat better?
Last year a number of comments criticized that I shopped in three different stores, had access to the internet to review sales circulars and plan based on sales, and had time to plan our meals before I shopped. For this challenge, I will shop in the closest grocery store to our house, will pick-up the circular when I enter the store and do my best without pre-planning the week since it was pretty clear that time and ability to plan ahead are both issues for many.
Like last year, I invite readers to step up to the challenge too and share your experience in the comments as we move forward for the week, starting tomorrow.
Here’s our rules for the October 2008 Food Stamp Challenge:
1. Maximum per person is $5.87 per person per day. For us, a family of three, this means I have to feed us with just $123.27 in the coming week. Your total budget does not include any sales tax since recipient purchases are not subject to sales tax.
2. Salt and pepper are considered in your pantry, so you do not need to buy either. But any other spices, condiments or cooking fats/oils do need to be purchased or you need to deduct a portion of your cost when you did buy the item that is in your pantry since it’s difficult to have a stocked pantry when you’re on food stamps. For example, if you do have chopped garlic in your house, you don’t have to buy another jar for the week, but should – if you use some – deduct a part of the cost. If the jar cost $5.00 and you use one serving from a 10-serving jar, take 50-cents off your budget to account for the garlic you used.
3. It’s best to plan ahead, so if you have mailed or newspaper ad circulars, review what’s on sale and make a list before you shop. This time around, I’ll personally not plan ahead like I did last year and I’ll shop in only one grocery store. You don’t have to unless you want to also.
4. If you have a child in school and they receive or buy lunch, do not deduct this from your budget. Any foods you pack for lunch or snacks does have to be part of your budget however.
5. The budget does not include paper products, cleaning supplies, over-the-counter medicines, prescription medication, or non-food items not covered by food stamps. If you do need to buy these while you’re shopping, just make them a separate order, paid for separately, so you can accurately add up what you’re spending on food only.
6. We can shop for, prepare and cook whatever we want to eat, and can eat free food at business functions, meetings, work, or other places just like anyone else; in addition we can sample from tasting stations in grocery stores, and eat at parties we attend, hosted by friends or family. We cannot take home leftovers to stretch our budget though.
7. We can also eat out – but do need to include any meals we pay for and include the tax and tip since food stamp recipients cannot pay for meals out with their debit card, but also do have the expectation that the food stamps are assistance, not their sole source of buying food…we’ll include any meals out in our total budget.
Basically, the challenge includes preparing and eating what you are able to purchase throughout the coming week, and any meals eaten out, since it’s one thing to have to shop with a limited budget and another to live with it for a week.
Who will join me this week?
Again this year, those participating in the challenge are encouraged to email me photos of their groceries for the week, along with recipes and meal ideas and insights about your experiences during the week. I’ll highlight them here on my blog next week and open discussion about the various challenges we all faced, and the things we learned along the way! As always your comments are welcome as the challenge gets underway!
Thursday, September 25, 2008

Wednesday, August 27, 2008
Public Comment Open at USDA
Last week, in the Atlanta Journal Constitution, an article revealed some
shocking school breakfast and lunch options: "Pop-Tarts and doughnuts
for breakfast for 2-year-olds. Rolls, chicken nuggets and French fries for
school lunches. Brownies given the same nutritional value as a slice of
whole-wheat bread."
This struck a chord with me since I recently posted on my blog about
the dismal lunches served in the Columbia Public Schools in Missouri.
One particularly disturbing lunch option - Smucker’s PBJ Uncrustable,
Pepperidge Farms Goldfish Pretzels, Rice Krispie Treat, 1% cholocate
milk, baby carrots and a fruit - is offered daily to students throughout the
district!
With 789-calories, the school's website highlights that the lunch contains
23g of protein (92-calories) and just 24% fat (189-calories; 21g); no
mention that this means the lunch also contains 508-calories from
carbohydrate (127g), or the equivalent of 32-teaspoons of sugar in a child's metabolism...not to mention if a parent packed such a lunch for their
child each day, they'd be branded as irresponsible and lending a hand
to the epidemic of childhood obesity!
With school back in session across many states, it seems we have a
pattern that shows school lunches are not as healthful as we're led to
believe!
Senatobia, Mississippi: Chicken Nuggets or BBQ Rib Sandwich, Mashed
Potatoes w/Gravy, Cheesy Broccoli, Hot Cinnamon Apples, Fruit Juice,
Yeast Roll, Gelatin. (assorted milk)
Randolph, Massachusetts: Nachos with cheese, beef, onion, tomato and
sour cream and fruit. (assorted milk)
Roff, Oklahoma: Corndog, tator tots, black-eyed peas, chocolate pudding
and milk.
Whittier, Massachusetts: Choice of Domino's of french bread pizza, small
salad, pretzel, assorted fruit. (assorted milk)
Folsom, New Jersey: Nachos with cheese or Smucker's PB&J, vegetable,
fruit and milk.
Ada, Oklahoma: Frito chili pie with cheese, green beans, garden salad,
rosy applesauce, salad bar and milk.
Benton, Arkansas: Pizza, corn, salad, half an orange, milk
Nachos, pizza, chicken nuggets, corndogs, frito chili pie....what is frito
chili pie anyway? And why are we not disturbed by these school lunches
offered to our kids each day?
Amazingly, each and every one of these lunches meet the minimum
standards for school lunches established by the USDA.
Which begs the question - how do we go about improving the minimum
standards for school lunches?
It turns out the Child Nutrition and WIC Reauthorization Act of 2004 is
up for review and revision in 2009, and you can provide comments about
ways to improve the school lunch program by either testifying at an
upcoming USDA Listening Session, or submit written comments online
or via mail.
If you'd like to submit comments online, you may at the Public Comment and Submission page.
If for some reason the above link fails to take you to the page for public
comment, the Docket ID is FNS-2008-0011 and the Docket Title is
Request for Public Comments for Use in Preparing for 2009
Reauthorization of the Child Nutrition Programs and WIC.
Monday, August 25, 2008
Investigate the Alternate Hypothesis
Ever since the publication of Gary’s Taubes’ Good Calories, Bad Calories, folks within the low-carb community have suggested and discussed various study designs to investigate the alternate hypothesis, the “Carbohydrate Hypothesis”, explored in the book. The biggest issue isn’t so much designing a study, but funding a study large enough and controlled enough to reach valid conclusions.
With obesity considered one of the most pressing health issues of our time, wouldn’t it be great if we could find the resources necessary to investigate, in a really well done trial, that alternate hypothesis?
Enter Project 10100 - a call for ideas to change the world by helping as many people as possible.
Project 10100 is accepting submissions of ideas for projects until October 20, 2008. One hundred ideas will be selected for public review and voting to narrow the field to twenty semi-finalists. An advisory board will then select five projects to fund from a commitment by Google of $10-million dollars.
One category is “Health” and the critera provided to help those submitting ideas includes:
Criteria:
Reach: How many people would this idea affect?
Depth: How deeply are people impacted? How urgent is the need?
Attainability: Can this idea be implemented within a year or two?
Efficiency: How simple and cost-effective is your idea?
Longevity: How long will the idea’s impact last?
Project 10100 may be a way to fund a study to investigate the Carbohydrate Hypothesis!
If you’d like to submit your ideas, you can go to the Project 10100 website, or directly to the submission page.
Friday, August 15, 2008
Gary Taubes - Columbia, MO - November 2008
Gary Taubes, author of Good Calories, Bad Calories and three time winner of the National Association of Science Writers’ Science in Society award, is scheduled to present his lecture, The Quality of Calories: Big Fat Lies: The Truth About Diet, Exercise and Obesity, on November 13, 2008 in Columbia, Missouri.
The event is sponsored by the Boone County Medical Society and the Department of Nutritional Sciences at the University of Missouri. It is free and open to the public. Registration is strongly recommended as seating is limited.
The presenation will take place at the Monsanto Auditorium (University of Missouri) at 2:30pm and will be followed by a reception in the McQuinn Atrium. More details are on the flyer below. To register online, click here.
Friday, August 08, 2008
Feeding Infants Fructose
Discussion: Consuming fructose during suckling may result in lifelong changes in body weight, insulin secretion, and fatty acid transport involving CD36 in muscle and ultimately promote insulin resistance.
That was the conclusion reached by researchers who published Dietary Fructose During the Suckling Period Increases Body Weight and Fatty Acid Uptake Into Skeletal Muscle in Adult Rats, in the journal Obesity.
While the study was on rats, it’s interesting to look at the ingredients in baby formula sold in the United States (all of the below are the first few ingredients listed from peapod.com and do not include the brand name):
INGREDIENTS: Nonfat Milk, Whey Protein Concentrate, Corn Syrup Solids…
INGREDIENTS: Corn Syrup Solids, Partially Hydrolyzed Nonfat Milk and Whey Protein Concentrate Solids, Vegetable Oil…
INGREDIENTS: Corn Syrup Solids, Vegetable Oil (Palm Olein, Soy, Coconut, and High Oleic Sunflower Oils), Casein Hydrolysate …
INGREDIENTS: Corn Syrup Solids (43.2%), Soy Protein Isolate (11.5%), High-Oleic Safflower Oil (10.3%), Sugar (Sucrose) (8.4%), Soy Oil (7.7%), Coconut Oil (7.7%)….
Is there a connection with rising prevalence of childhood obesity and feeding infants corn syrup solids? Things that make you go ‘hmmmm’
Friday, August 01, 2008
My New Blog Home
Well, I decided to migrate my blog, Weight of the Evidence, to WordPress. This was due to Blogger locking my blog under the mistaken belief it was a “spam blog”. I have some minor work to do on the posts that migrated to get them properly tagged – but should have that complete by the end of next week.
For anyone who has my old blog address in their links (weightoftheevidence.blogspot.com) – please change the link to www.WeightoftheEvidence.com – Thank you!
For anyone who has my old blog address in their links (weightoftheevidence.blogspot.com) – please change the link to www.WeightoftheEvidence.com – Thank you!
Friday, July 25, 2008
Chew on this...
The Cochrane Database of Systematic Reviews recently withdrew a document within its collection - Advice on low-fat diets for obesity.
As we learn on The Cochrane Collection website, the editorial group responsible for this previously published document have withdrawn it from publication.
The reason cited for the withdrawal?
This review is withdrawn because it is very much out of date, as authors stated. None of the authors has any plans to update it.
Saturday, July 19, 2008
Thursday, July 17, 2008
Two Year Dietary Trial Results: Low-Carb Better than Low-Fat
The study just published in the New England Journal of Medicine, Weight Loss with a Low-Carbohydrate, Mediterranean, or Low-Fat Diet (free full-text), is quite a read, with lots of data and lots of findings to explore and look at!
First things first - the objective of the study was to compare the effectiveness and safety of weight loss diets over a two year period.
The dietary approaches included in the study:

First things first - the objective of the study was to compare the effectiveness and safety of weight loss diets over a two year period.
The dietary approaches included in the study:
- a low-carb diet, loosely based upon the Atkins diet, no calorie restriction
- a Mediterranean diet, calorie restricted, based on the recommendations of Dr. Willett & Dr. Skerrett (Eat, Drink & Be Healthy)
- a low-fat diet, calorie restricted, based on the American Heart Association guidelines
In addition to weighing participants each month and measuring waist circumference, the researchers measured at reporting invervals (6-months, 12-months and 24-months) total cholesterol, LDL, HDL, triglycerides, fasting blood glucose, fasting insulin, HbA1C, blood pressure, HOMA-IR, C-reactive protein, leptin, adiponectin, bilirubin, alkaline phosphatase, alanine aminotransferase and urinary ketones.
Enrolled in the study were 322 volunteers; they were provided their largest meal each day (lunch) at work, and given support and guideance about their diet throughout the study period. Of the 322 who started the trial, 95.4% completed one year, and 84.6% (272 participants) completed the 24-months - making this perhaps, the best adherence level in a dietary trial lasting two years!
So what happened? Let's look at the various outcome measures to see.
Weight Loss
The mean weight changes among the 272 participants who completed 24 months of intervention were:
–3.3 ±4.1 kg in the low-fat group (7.3-pounds)
–4.6 ±6.0 kg in the Mediterranean-diet group (10.1-pounds)
–5.5 ±7.0 kg in the low-carbohydrate group (12.1-pounds)
(p=0.03)
Overall, in the intent to treat data (which includes even those subjects that did not complete the study) the weight loss was reported as:
–2.9 ±4.2 kg for the low-fat group (6.4-pounds)
–4.4 ±6.0 kg for the Mediterranean-diet group (9.7-pounds)
–4.7 ±6.5 kg for the low-carbohydrate group (10.3-pounds)
The reason I note the two findings is that in the media reports, the trend appears they're reporting the intent-to-treat numbers, which are lower because they include the 50 subjects that dropped out. Those who actually completed the study are the data I prefer to look at for weight loss since it accurately presents how effective the dietary approaches are when continued for two years!
Waist Circumference
-2.8 ±4.3 cm in the low-fat group
-3.5 ±5.1 cm in the Mediterranean-diet group
-3.8 ±5.2 cm in the low-carbohydrate group
Lipid Profiles
The graph itself speaks volumes:
High-Sensitivity C-Reactive Protein, High-Molecular-Weight Adiponectin, and Leptin
The level of high-sensitivity C-reactive protein decreased significantly only in the Mediterranean-diet group (21%) and the low-carbohydrate group (29%), during both the weight-loss and the maintenance phases, with no significant differences among the groups in the amount of decrease.
During both the weight-loss and the maintenance phases, the level of high-molecular-weight adiponectin increased significantly in all diet groups, with no significant differences among the groups in the amount of increase.
Circulating leptin, which reflects body-fat mass, decreased significantly in all diet groups, with no significant differences among the groups in the amount of decrease; the decrease in leptin paralleled the decrease in body weight during the two phases.
Fasting Plasma Glucose, HOMA-IR, and Glycated Hemoglobin
Among the 36 participants with diabetes, only those in the Mediterranean-diet group had a decrease in fasting plasma glucose levels (32.8 mg per deciliter); this change was significantly different from the increase in plasma glucose levels among participants with diabetes in the low-fat group.
This is critically important to note - the low-fat group experienced a rise in fasting blood glucose over the course of the two years; this despite a greater calorie deficit than the other two diets, and a greater increase in physical activity! Yet, this type of diet is exactly how the ADA recommends people at risk for or diagnosed with diabetes eat, while expecting ever increasing doses of medication to cover their progressive decline in glycemic control.
It is also noteworthy that, "there was no significant change in plasma glucose level among the participants without diabetes." Basically those who did not have diabetes did not experience any change in their values over the period of the study.
What the researchers did not note in their written text of the results was this - the low-carb dieters had similar declines in their fasting blood glucose levels through month 12, followed by a progressive decline through month 24.
If we look at the data provided, we can see something important changed - the quality of the carbohydrate they consumed seems to have declined. If you look at the table providing details of the dietary intakes, one major change in the low-carb group between moth 12 and month 24 pops out - as the study progressed, the consumed less and less fiber on average, compared with their baseline intake. Now early on, that's to be expected. Later, as carbohydrate is increased - if quality whole foods are the choice - fiber typically increases!
In contrast, insulin levels decreased significantly in participants with diabetes and in those without diabetes in all diet groups, with no significant differences among groups in the amount of decrease.
Among the participants with diabetes, the decrease in HOMA-IR at 24 months was significantly greater in those assigned to the Mediterranean diet than in those assigned to the low-fat diet.
Again, in the text, the researchers do not note if there were changes in HOMA-IR in the low-carb group. There was - over the 24-month period, the HOMA-IR in those with diabetes, following the low-carb diet, declined by 1.0; in those with diabetes following the low-fat diet the decline was 0.3; and in those with diabetes following the Mediterranean diet the decline was 2.3.
The last item reported in the section was the HbA1C levels. Among the participants with diabetes, the proportion of glycated hemoglobin at 24 months decreased by:
0.4 ±1.3% in the low-fat group
0.5 ±1.1% in the Mediterranean-diet group
0.9 ±0.8% in the low-carbohydrate group
The changes were significant only in the low-carbohydrate group.
The lower HbA1C is perhaps one of the most important outcomes of this study. The diabetics, in the low-carb group, were able to lower their levels by 0.9 over the 24 months and this was significantly greater than those in the two other diets. Unfortunately the researchers did not include the baseline HbA1C for participants, so we do not know what the reduction really means.
Liver-Function
Tests Changes in bilirubin, alkaline phosphatase, and alanine aminotransferase levels were similar among the diet groups
Alanine aminotransferase levels were significantly reduced from baseline to 24 months in the Mediterranean-diet and the low-carbohydrate groups.
The Good, Bad, and Why oh Why?
Overall, most reporting on the study today, feel the research team did a good job designing the study and executing it, many applauding the high rate of retention in the study for two years. I too am impressed that the participants remained committed to the trial, their assigned diets, and the longer-term outcome measures!
I personally would have liked more information than was published.
Key information regarding the baseline diet was not included in the data - not published items include how many calories were consumed, on average, at baseline; nor do we know how much protein, carbohydrate, fat or fiber was in the baseline dietary habits of those participating. While obviously not critical, it is 'nice to know' data.
I also would have liked to see the researchers have the courage to actually follow the Atkins dietary approach, and not make changes based on a number of assumptions.
We do not, for example, know what the outcome would be if the participants on the low-carb dietary arm had not been told to specifically choose vegetable based fats over animal fats. Atkins does not specifically state you must eat butter, but the diet allows butter. In addition, encouraging the consumption of plant-based proteins over animal proteins is another tweak that may not have had any effect, or may have had a positive or negative one. We simply do not know because the researchers encouraged plant-based protein consumption rather than leave the dietary recommendations as they are - meats, eggs, poultry, fish, tofu and such are allowed, ad libitum. [please see update below!]
The reporting in the media, as my earlier post highlights, has been quite an eye-opener. I'm not sure if those quoted realize it or not, but their reaction to the study is quite telling, especially those with the strongest vested-interests in maintaining the status quo.
In the Wall Street Journal, Robert Eckle, the past president of the American Heart Association and a professor of medicine at the University of Colorado Health Sciences Center, said he was not ready to recommend an Atkins-type low-carb diet based on the results. People on a low-carb diet increased their consumption of saturated fat, he said, which could not be good for them in the long run.
Did he even bother to read the findings?
Or maybe he was just disappointed the AHA's recommended diet - the diet recommendations the low-fat group were instructed to follow - did so poorly compared to the other two?
Did he know that the study author, Dr. Meir Stampfer of Harvard Medical School, in the same article, said "It is time to reconsider the low-fat diet as the first choice for weight loss and for cardiovascular health, it is not the best."
I think tomorrow, we'll take a fun ride through many of the quotes and opinions offered on this study!
In the meantime, what are your thoughts? Feel free to leave comments!
UPDATE 7/18/08
I received an email today from a friend who asked one of the researchers about the reference to plant-based (vegetable) fats and proteins. Dr. Shai assured him that the low carbohydrate group was not advised to consume a vegetarian low-carb diet, nor were they specifically restricted from eggs, cheese, red meat, poultry or fish. Due to dietary restriction (religious) the group would not, for instance have a cheeseburger or butter on top of their steak. Olive oil featured prominently. The participants did read the Atkins diet book. And the examples provided of the types of meals was "For example, a plate could include : fish or fried/not bread coated chicken/or red meet, broccoli and mushrooms coated with eggs, roasted eggplants, vegetable salad (peppers, cucumber, green leaves, notlettuce) with olive oil dressing.
One Study, A Myriad of Opinions
The buzz across the internet today is the findings from the paper, Weight loss with a Low Carbohydrate, Mediterranean, or low fat diet, published in the New England Journal of Medicine.
The headlines are all over the place regarding what the results mean:
Low-Carb and Low-Fat Diets Face Off
The Never-Ending Diet Wars: Why Atkins Still Doesn't Beat Low-Fat Diet
Healthy Diets Shown to Have Benefit Despite Modest Weight Losses
More Evidence that Diets Don't Work
Diet Study: Hold the Carbs, Not the Fats
Against the Grains
Diet Plans Produce Similar Results
Unrestricted Low-Carb Diet Wins Hands Down
Atkins Diet is Safe and Far More Effective Than a Low-Fat One, Study Says
Low-Carb and Mediterranean Diets May Equal Watching Fat Intake
It's amusing that each of the above headlines are all reporting on the same study!
Later today, in another post, we'll set aside the headlines and simply look at the study itself and the results.
The headlines are all over the place regarding what the results mean:
Low-Carb and Low-Fat Diets Face Off
Dr. Meir Stampfer, the study's senior author and professor of epidemiology and
nutrition at Harvard School of Public Health, told ABC News: "The low-carb diet
was the clear winner in providing the most weight loss."
The Never-Ending Diet Wars: Why Atkins Still Doesn't Beat Low-Fat Diet
"An optimal diet is one that is low in fat (because fat, whatever the type, has
9 calories per gram versus only 4 calories per gram for protein and
carbohydrates). When you eat less fat, you consume fewer calories without
having to eat less food, because the food is less dense in calories, as well as
low in refined carbohydrates."
Healthy Diets Shown to Have Benefit Despite Modest Weight Losses
In a tightly controlled dieting experiment, obese people lost an average of just
6 to 10 pounds over two years. The study, published Thursday in The New
England Journal of Medicine, was supposed to determine which of three types of
diets works best. Instead, the results highlight the difficulty of weight loss
and the fact that most diets do not work well.
More Evidence that Diets Don't Work
After two years of effort the dieters lost, on average, 6 to 10 pounds. The
study, funded in part by the Atkins Research Foundation, seemed designed to
prove that low-carb diets trump low-fat diets. But in the end, all it really
showed is that dieters can put forth tremendous effort and reap very little
benefit.
Diet Study: Hold the Carbs, Not the Fats
Low-carbohydrate and so-called Mediterranean diets may be more effective than
low-fat diets, according to a major new study published in tomorrow’s New
England Journal of Medicine.
Against the Grains
Carbohydrates have taken another hit. A new study finds that a low-carb diet
results in greater weight loss and better cholesterol readings than a low-fat
regimen that promotes a lot of grains and fruits.
Diet Plans Produce Similar Results
New research shows that Mediterranean and low-carb diets are just as good and
just as safe as the low-fat diet often prescribed by doctors, a revelation that
should give people more choices in eating well.
Unrestricted Low-Carb Diet Wins Hands Down
The similar caloric deficit achieved in all diet groups suggests that a
low-carbohydrate, non–restricted-calorie diet may be optimal for those who will
not follow a restricted-calorie dietary regimen.
Atkins Diet is Safe and Far More Effective Than a Low-Fat One, Study Says
The controversial Atkins diet is just as effective and safe as a conventional
low-fat diet, a two-year study has found. Researchers found that
overweight volunteers shed more pounds on the low carbohydrate regime than they
did on an orthodox calorie-controlled diet.
Low-Carb and Mediterranean Diets May Equal Watching Fat Intake
Explain to interested patients that the study suggested low-carbohydrate and
Mediterranean diets could be as effective as the traditionally recommended
low-fat diet for weight loss.
It's amusing that each of the above headlines are all reporting on the same study!
Later today, in another post, we'll set aside the headlines and simply look at the study itself and the results.
Wednesday, July 09, 2008
Shame on Missouri!
Yes this is going to be a rant!
Yesterday I was alerted to the newly proposed changes, open for public comment, in the Missouri Eat Smart Guidelines - standards for school lunches (and breakfast) in my state. When I first opened the document, I was not surprised by the incremental reduction of dietary fat and the push for more fiber, especially with whole grains.
What did surprise me was the absolute lack of attention to nutrient-density at each category level. Oh, there is a minimum which applies to each category - the minimums established by the USDA that establish minimum calories, fat not to exceed 30%, acceptable levels of protein, cholesterol, sodium and fiber, along with target minimums for calcium, iron, and vitamins A and C.
So the committee drafting the newly proposed "expemplary" category didn't think it wise to perhaps set the bar higher - ya know, establish benchmark minimum for other micronutrients...maybe the same ones identified as deficient in our children in Missouri?
Hey, the starting document to consider this could be the Missouri Department of Health & Senior Services (DHSS) recently published Dietary Intake Summary Report for school year 2000-2001 - in it the DHSS reported finding the vast majority (greater than 50%) of all children in the state fail to meet RDA requirements for vitamin A, iron, calcium, folate and zinc, and 25% fail to meet requirements for protein, vitamin B6 and vitamin C.
HELLO!
We have a serious problem with malnutrition and the best the Missouri Eat Smart Guidelines committee can come up with is stricter limits on dietary fat and increasing fiber?
Has the committee that drafted this guideline even looked at what is being served in our schools?
Columbia public schools offer this delight each day:
Smucker's PBJ Uncrustable, Pepperidge Farms Goldfish Pretzels, Rice Krispie Treat, 1% cholocate milk, baby carrots and a fruit.
Can you imagine what would be said to a parent packing such a lunch for their child?
But guess what? That lunch conforms to the standards for low-fat with just 21g of dietary fat (24% of calories) - just ignore the fact that once protein is tallied, carbohydrate accounts for 508 of the 789 calories - that's 127g of carbohydrate, or the equivalent of 32-teaspoons of sugar in a child's metabolism in one meal!
But hey, it provides 6g of fiber - above the target 5g standard, right?
The public schools have the audacity to call that abomination a nutritious lunch?
Oh, and don't get me started on the soy-based products being used in meals and that fact not being disclosed to parents, unless of course, they poke around to read the allergen lists.
Beef Tacos on the menu?
I'd expect they're made with beef, wouldn't you? Nope...they're based on an "enriched" product schools purchase - made with some beef and an ingredient listed as "VPP" - vegetable protein product - better known as soy protein.
Chicken Nuggets on the menu?
I'd expect they're breaded chicken pieces, wouldn't you? Nope...they're also based on an "enriched" product schools purchase, already prepared - made with some chicken and an ingredient listed as ISP - isolated soya protein.
Think it can't get worse?
I don't think schools do much more than open a can, heat and serve these days - just reading through the spreadsheets available online makes that pretty clear - almost everything sold in school breakfast and lunches are convenience foods, from various vendors, that are nutritionally bankrupt, but easy to heat and serve.
If a parent were to habitually feed their child that crap, at the very least they'd be chastized as irresponsible - yet this is how the schools operate each day, serving what can only be called food-garbage each day and they have audacity to label them "healthful" and nutritious.
When you have a chance, read through the proposed Missouri Eat Smart Guidelines, then let the committee know what you think in the open public comments!
If people don't start speaking up, and demanding truly nutrient-dense meals for their children, it's only going to get worse!
Thursday, June 19, 2008
Caution: Childhood Obesity
In the last month, two major media sources (Washington Post and Time magazine) have devoted page upon page to the epidemic of childhood obesity.
Washington Post: Young Lives at Risk: Our Overweight Children
Time: Our Super-Sized Kids
There is no doubt in my mind that there are, indeed, more children who are much heavier today than there were when I was growing up, and that parents of obese children should have access to resources to help them help their child.
What I find disturbing is that the current level of alarm, hysteria and obsession with children's growing waistlines hasn't caused any to pause, step back, and examine the facts. Instead, it seems, the drum beats on to reduce calories, reduce fat, add mroe fruits and vegetables, lots of whole grains and increase activity.
The message is part of a perpetual campaign to convince our population that we must do it "for the children," with an indictment against parents who are said to not see nor do anything about their fat children; that the community, doctors, schools, health organizations, the food industry and the government must lead these wayward parents to understand how to improve both diet and activity levels for their children.
We see and read about extreme cases of childhood obesity, extreme examples of poor eating habits, and extreme lifestyle habits; we're reminded that is how it happens - too much food and not enough activity, the recipe for growing fat children in America today.
But excess accumulation of fat isn't the only problem - we're also hit with the sobering reality that, in addition to heavier children, our children are also growing sick sooner; we're told of children with type II diabetes (once called "adult onset" diabetes since it was virtually unheard of in children or teens), dyslipidemia, PCOS, metabolic syndrome, precocious puberty, high blood pressure, heart disease and more. The statistics are frightening and we're constantly reminded that today's children will likely die earlier than their parents if we don't do something!
The mind-numbing statistics, experts expressing grave concerns, fine examples of poor eating habits, and images of the most extreme cases of obesity in children all work to create a strong sense that we all must do something, that all of our children are at risk, that the future is at stake if we don't do the right thing and do it now!
Is the hype really helping?
Are the solutions on the table going to work not only to prevent childhood obesity, but reverse it in those children whom are already obese?
Considering the solutions presented today is identical to the solutions offered throughout the past three decades, I can only conclude things will get worse not better; the longer it goes on, the stronger the pressure on parents will grow to 'get with the program' and follow the direction of the expert recommendations.
As parents, we have an obligation to protect our children, keep them safe, nurture them and do the best we can as we raise them.
My previous post provided an example of how the current guidelines to use BMI as the gold standard measure of overweight and obesity in children is problematic. The fact that a child can be a normal healthy weight in one month and then overweight or obese in another without any change in weight or height tells us the charts are inaccurate. The fact that the hypothetical child would have dropped from 59th to 52nd percentile for weight on the traditional chart, but went from normal to overweight on the BMI chart, speaks volumes about its deep flaws.
What's telling is that almost all the comments left in the hypothetical 'set-up' of the situation post were the belief the child gained weight. That is understandable, given the repeated message we all hear that overeating and inactivity make you gain weight. If the child now had a BMI indicating she was overweight, she must have gained weight if her BMI just two months ago said she was normal-healthy weight. Too bad it wasn't true.
If we, as parents and a nation, truly wish to resolve the issue of childhood obesity, we must begin to re-examine our assumptions and how we've arrived where we are today. Our children are not only growing fatter, they're growing sicker, and doing the same thing with only the volume turned up on the message isn't going to change this. Throwing medication at the problem isn't going to make it go away. Surgical intervention isn't going to reverse it, and certainly can't prevent it before the fact.
We have the answer, yet we ignore it.
We'll explore that in another post coming soon!
In the meantime, feel free to leave your comments about the issue of childhood obesity, its causes and its solution.
Wednesday, June 18, 2008
Nothing Changed But Her Age
In my earlier post, about the little girl, absolutely nothing changed in two months, other than she was now 3-years 10-months old and before was 3-years 8-months old.
I charted the hypothetical little girl at 3-years 8-months as standing 38" tall and weighing 34.5-pounds - placing her in the 84th percentile for BMI for age, the top of the "normal healthy weight" classification. With no upward growth and no weight gain in two months, this same child would now be in the 85th percentile for BMI for age, making her "at risk for overweight" in some circles, or simply "overweight" in others.
Interestingly, if we calculate her traditional fall on the height and weight charts, her weight at 3-years 8-months places her in the 59th percentile for weight for age; at 3-years 10-months it's dropped to the 52nd percentile for weight for age. Yet this child is now labeled as being among the statistics of overweight and/or obese children.
The dirty little secret about children's BMI charts is they slope downward starting at age 2 until about age 6! Take a look:
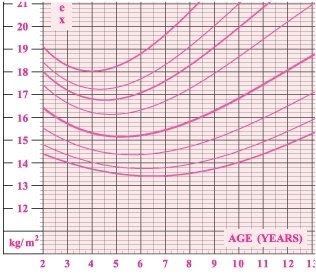
How often do we read or hear how parents are totally blind to their child's weight problems?
How many out there realize the difference between "normal healthy weight" of a three year old girl and 'at risk for overweight" (or overweight) is just 0.5-pounds, to be classified "overweight" (or obese) it's just one more pound if you use the BMI for age chart?
How many realize that within as short a period of time as a month, with no gain or loss and no upward growth a child can move from one category, normal healthy weight, up to overweight?
Yet this is the "gold standard" we parents are told is best to determine if our child is overweight or obese, in need of intervetion to prevent them from becoming an obese adult!
What do you think?
You can go play with the calculators available online:
Children's BMI Calculator
Children, Age 2 to 20, Growth Chart Percentiles Calculator
How Does It Happen?
 Imagine for a moment, you're a parent - of an adorable 3-year old girl. Since birth she's thrived and is quite the little social butterfly now that she's getting older. She eats well, plays hard and is just a delight. Your last visit to the pediatrician, when she was 3-years 8-months old, went great - with all the alarms about childhood obesity, you were pleased the doctor was so proactive to weigh and measure her, even more happy when he declared she was a healthy weight and doing great!
Fast forward a couple of months, today your little girl has what seems to be a cold that's progressing, so you make an appointment and the doctor's office squeezes you in.
When you arrive, the nurse takes you into the exam room, weighs and measures your daughter (just like last time) and takes her temperature. She asks you to wait a few minutes, the doctor will be in soon.
A short time passes and the doctor comes in, examines your daughter and doesn't think it's something that needs antibiotics and explains how to monitor her fever and keep her hydrated. He then says, we need to talk about her weight, her BMI places her in the 85th percentile, which puts her at risk for overweight.
You're stunned!
How could this have happened in just two months?
How is it possible you've not seen this coming?
Tuesday, June 17, 2008
What Do the Obese Think?
A recent survey found that being obese invites social discrimination, but the obese do not wish to be labeled as "sick" or diseased. As noted in the press release about the survey findings:
"Obese people frequently feel overwhelmed and disheartened by the publicity about their condition," he said. "They often feel disrespected and not understood by medical practitioners. Our participants express the view very forcefully that they feel victimized by current social attitudes about obesity. To be told that, in addition to the problems that they recognize only too well, they are now regarded as 'sick' is unlikely to assist them to find a solution."
Study participants said they find it difficult to act on the health messages about obesity, he said. Most participants reported that they had tried weight loss remedies that their physician recommended and were generally dissatisfied with the help doctors provide.
Health care providers' efforts to convince overweight patients to lose weight are largely unsuccessful, Komesaroff believes, possibly because they do not understand the key issues that obese people face.
More A to Z Diet Trial Data
Readers may recall that last year, in March 2007, a study was published from a dietary trial comparing four dietary approaches for weight loss: Atkins, Ornish, LEARN and Zone - the A to Z Weight Loss Study.
Many reading through the findings cried foul - those in the Ornish group hadn't reduced their fat sufficiently, those in the Atkins group consumed more carbohydrate than recommended, and so on.
In my blog post I noted "...this study failed to achieve compliance out of the gate!"
I also noted that "We have before us is a study that really does indicate carbohydrate restriction can work well over a period of one year. Without sub-group analysis to evaluate results tied to compliance (hey, some of the participants had to be doing the various diet right, dontcha think?) we can't know just how effective doing Atkins or any of the diets is with good compliance though since the researchers didn't take their data to that level of analysis in this paper."
Ask and ye shall have an answer!
A follow-up paper was published in the International Journal of Obesity - Dietary Adherance and Weight Loss Success Among Overweight Women: Results from A to Z Weight Loss Study.
As the researchers note in the background of their abstract: "Dietary adherence has been implicated as an important factor in the success of dieting strategies; however, studies assessing and investigating its association with weight loss success are scarce."
Their objective?
"We aimed to document the level of dietary adherence using measured diet data and to examine its association with weight loss success."
And so they performed a secondary analysis on the data from the trial and lo' and behold, those who closely adhered to the dietary recommendations of their assigned diets were found to have greater weight loss when compared with those less compliant with their dietary recommendations.
The researchers found that "within each diet group, adherence to score was significantly correlated with 12-month weight change."
Atkins rs= 0.42 p=0.0003
Zone rs= 0.34 p=0.009
Ornish rs= 0.38 p=0.004
When comparing the highest level of compliance with the lowest the researchers noted significant differences in weight loss in the Atkins group!
Atkins
Highest compliance = 8.3kg
Lowest compliance = 1.9kg
p = 0.0006
Zone
Highest compliance = 3.7kg
Lowest compliance = 0.4kg
p = 0.12
Ornish
Highest compliance = 6.5kg
Lowest compliance = 1.7kg
p = 0.06
The researchers concluded, "Regardless of assigned diet groups, 12-month weight change was greater in the most adherent compared to the least adherent tertiles. These results suggest that strategies to increase adherence may deserve more emphasis than the specific macronutrient composition of the weight loss diet itself in supporting successful weight loss."
The Other Side of the Obesity as Disease Debate
Obviously the debate about classifying obesity a disease is not a new idea, for years various researchers, special interest groups and organizations have debated the merits of defining obesity as a disease, with each round of reasoning and review of the evidence leading to the determination that obesity is not a disease unto itself, leaving it to remain categorically a health issue - a risk marker and a condition one is better to address than to ignore, but not a disease in need of specific medical intervention per se, but a condition with treatment options at the discretion of those within the medical community treating obese patients.
This distinction is important - while medical interventions are available, they are not the sole option for those who are obese; nor are all individuals with a BMI of 30 or greater automatically deemed to have a chronic disease in need of treatment by licensed healthcare professionals. If someone is obese, they are clearly able to seek medical treatment if they desire that option, just as they can opt instead to join Weight Watchers, read and follow the South Beach Diet on their own, or, gasp!, do nothing if their obesity is not causing them other health problems.
In order to fully understand the implications of the current position foisted in the Obesity Society white paper, it's important to look at the arguments as they've developed over the years. One exceptionally well written paper was published in October 2001 in the International Journal of Obesity - Is Obesity a Disease?
In that paper, the authors take time to review and discuss the "characteristics of obesity to determine if they fit the common and recurring elements of definitions of disease." They utilize a sample of definitions of disease taken from "authoritative English language dictionaries" to determine a common understanding of what defines "disease" and from there, examine if obesity fits the definition.
They tell us, "we identified the following common and recurring components:
(a) a condition of the body, its parts, organs, or systems, or an alteration thereof;
(b) resulting from infection, parasites, nutritional, dietary, environmental, genetic, or other causes;
(c) having a characteristic, identifiable, marked, group of symptoms or signs;
(d) deviation from normal structure or function (variously described as abnormal structure or function; incorrect function; impairment of normal state; interruption, disturbance, cessation, disorder, derangement of bodily or organ functions)
Then ask, "[h]ow well does obesity fit the definition of disease?"
Using the above criteria for disease, they evaluate whether defining obesity as a disease can be accomplished within the definition of disease.
There should be little disagreement that obesity satisfies conditions (a) and (b) above. That is, (a) an excess accumulation of fat can certainly be thought of as a condition of the body, and as for (b), the list of potential causes is so extensive that the causes of obesity must surely be found there.
Condition (c) poses a problem. Indeed, obesity can be diagnosed visually from physical proportions, or with the help of height and weight measurements. In cases of doubt, body composition methodologies offer numerous methods to measure body fat to the required degree of precision. However, there are no signs that inevitably characterize the condition other than the excess adiposity, which is the definition of obesity. The causes of obesity are numerous and diverse, ranging from and including combinations of environmental, behavioral and genetic aspects of energy intake, partitioning and expenditure. Its common accompaniments¾impaired glucose tolerance, dyslipidemia, hypertension¾are not inevitably present. Thus, condition (c) is met, but only in a circular or tautological sense: the only characteristic (pathonomic), identifiable sign of obesity is also the characteristic which defines obesity, ie fatness.
Condition (d) is even more problematic. The deviations specified range from simple deviation from normality, to impairment, interruption or cessation of vital functions. Moreover, what is meant by deviation from normality is not clear¾it can imply undesirable variation or simple statistical rarity.
Evidence for impaired physical and social functioning in severe obesity (eg BMI>40) clearly exists. In these cases, excess fat is usually accompanied by various signs of impairment and it can be argued that severe or extreme obesity would usually meet condition (d) for most definitions of disease, including those which specify impairment of function.
However, impairment is not inevitable or even usual in most persons who meet the present BMI or percentage fat criteria for obesity. In contrast to severe obesity, mild obesity only 'threatens' eventual impairment inasmuch as a risk factor, by definition, confers a greater probability of some future adverse event. Yet its association with these events is, at our present state of understanding, probabilistic. We cannot foretell who will develop an obesity-related health problem. In fact, some persons who meet the criteria for obesity will live long lives free of any of the morbidities known to be influenced by obesity. We are therefore placed in the conceptually awkward position of declaring a disease which, for some of its victims, entails no affliction.
Many obese persons are competent, functioning members of society. Nor do these persons necessarily subjectively consider themselves impaired, except perhaps insofar as they feel themselves victims of social discrimination. They might fail to meet some arbitrary standard of physical fitness (eg climbing stairs, running) but such a standard would also exceed the capability of many non-obese but sedentary individuals. While physical fitness is desirable, its absence has not generally been considered an impairment. It would be possible to set an arbitrary standard of fitness which many obese and non-obese people would fail to meet, and to consider this as evidence of impairment; however the present criteria for obesity do not do so.
A further conceptual problem arises when obesity occurs in a disease such as Cushing's Syndrome. Obesity is one of the components or signs of that syndrome. Is the obesity which is a sign of Cushing's disease, itself a separate disease?
In sum, to call obesity defined solely on the basis of a BMI or percentage body fat in excess of some threshold a disease leads immediately to the following problems:
- the only sign or symptom may be the excess fat which is also the only defining feature of the condition¾there are no other inevitable clinical or subclinical signs;
- many obese persons suffer no impairment as a consequence of their obesity;
- it ignores the probabilistic nature of the relation between obesity and consequent adverse events which is accurately conveyed by the term risk factor;
- it poses conceptual problems, eg is the obesity which is a sign of a disease, itself a disease?
They continue on, at great length about the various ethical issues involved - from the creation and fostering of a victim 'mentality' of the obese, to the issue of responsibilities that range from patient behaviors to obligation to provide medical treatment, from the problems of vested interests leading the cause to declare obesity a disease to determining who pays for treatments.
They come full circle and conclude, "None of the foregoing is meant to argue that obesity is not a public health problem of the first magnitude. However, it would be a mistake to attempt to label it a disease in the traditional sense in order to emphasize its importance if it does not meet reasonable criteria for such diseases. Conceptual clarity is a cardinal virtue in science and philosophy and it should not be sacrificed to expediency.
Finally, it seems neither logically necessary nor tactically essential to have obesity labeled a disease in order for it to be taken seriously. Public health measures and preventive medicine often receive generous funding (eg annual physical examinations, immunization programs, smoking cessation campaigns, promotion of exercise and active lifestyles). Whether and how our institutions and organizations pay for obesity treatment should ultimately depend on what health outcomes we value, how much we value them, and the cost of achieving them, not on whether obesity is labeled a disease."
Monday, June 16, 2008
Is Obesity a Disease?
I left readers with photos of three incredibly fit men on Friday - each is an elite athlete in the octagon, practicing mixed martial arts, at the top of their game.
I asked one question, aside from the UFC, what do they share in common?
Many answered they all share the common BMI classification "obese" - although that is correct, the answer I was going for was they're all "diseased" and in need of medical treatment for their obesity according to the authors of a new white paper published by the Obesity Society.
That's right, if the opinions expressed in this white paper are adopted, the men pictured would all be considered suffering a chronic, debilitating disease which needs treatment by healthcare professionals.
The committee that drafted the position paper took the unusual step to discard the evidence-based (forensic) model and opted for a philosophical argument from a utilitarian perspective.
While they credit themselves for taking this approach because "there can be no higher authority than reason," they ignore the important qualification for something to be declared a disease - is it a disease?
This abandonment of evidence, data and scientific inquiry undermines their approach by simply skirting the true purpose to determine if something is rightly, indeed, a disease state. To get around this wee inconvenience, instead they argue "...the utilitarian argument can address the question "should obesity be declared a disease?" as opposed to "is obesity a disease?"
The ramifications of this mind-bending mental-gymnastics are far-reaching, the authors ignore the moral and ethical can of worms opened if their position is adopted, with their beliefs trumping evidence as they remain steadfast in the belief that it doesn't matter *if* obesity is a disease, it should be declared one anyway because,
"Many obese people are desperate for treatment - the number of people who self-treat and those treated by commercial programs is larger than the number currently treated by the medical establishment. If obesity were considered a disease and entitled to the same considerations given to other diseases, treatment paradigms would change fundamentally...If treatment were covered, more physicians would be likely to engage patients in treatment protocols. The FDA would come under pressure to approve obesity drugs, and physicians would be more likely to use obesity drugs in treatment...With this increased attention, medical treatment options, especially drug treatment, likely would become more aggressive. Medical treatment and obesity surgery would be given more attention by physicians, health administrators, insurance companies, and employers, resulting in greater access by patients to higher quality care."
For those unaware of the various philosophical approaches, Utilitarianism is the idea that the moral worth of an action is solely determined by its contribution to overall utility, that is, its contribution to happiness, satisfaction, preferences or pleasure as summed among all persons affected. This is a form of consequentialism - the moral worth of an action is determined by its outcome - the ends justifies the means.
Because it is an 'ends justifies the means' line of thinking, it can be characterized as a quantitative and reductionist approach to ethics. And to be sure, this issue has far reaching ethical and moral implications - in the stroke of a pen, this perspective potentially takes 1/3 of our population and defines them as diseased, in need of medical intervention and treatment, by way of the crudest measure of obesity - the BMI.
As the three men in Friday's post highlight, obesity as defined by BMI is unreliable, thus flawed as a measure to determine if one is obese. This flaw isn't news, it's well established in the medical and research community as problematic, which is a reason why many continue to suggest the utilization of more refined measures, like waist-hip ratio and/or an actual measure of body fat percentage.
But even this well known flaw does not stop the authors from even suggesting the BMI standard be LOWERED to classify obesity! That's right, not only do these folks think we should abandon medical standards and wax lyrical about how obesity should be declared a disease, they also feel the BMI needs to be lower too!
Sandy Szwarc at Junkfood Science has a well written article about the paper already, so I'll skip the points she already made. I'll note here that one sentence bears repeating about why the philosophical approach in this paper is wrong, "By this logic, or course, poverty could be a disease... Black or ethnic minority a disease... Old age a disease... Homosexuality a disease... Ugliness a disease... Low intellect or literacy a disease."
In addition to the points made by Sandy, a big issue remains - what about the legal issues and medical ethics involved if obesity were declared a disease?
First and foremost is that should obesity be declared a disease, therefore a chronic medical condition, it would then follow that only licensed healthcare professionals would be qualified to treat obesity. The treatments would, of course, include a handful of diet pills, lifestyle interventions and/or bariatric surgery. Fully medicalized as a disease, obesity would no longer be 'treated' outside the licensed medical community because anyone offering services to the obese would be practicing medicine without a license since all disease treatments are the protected domain of licensed healthcare professionals.
More importantly however, is the problematic position "declaring obesity a disease" becomes for the healthcare professional. We'll explore these issues throughout the coming week.
What do you think? Should obesity be declared a disease? Why or why not?
Friday, June 13, 2008
What Do You See?

 Other than being UFC fighters, what do these three men, Shane Carwin in the top photo and Cain Velasquez to the left and Brad Morris to the right in the bottom photo, share in common?
Guess in the comments and I'll explain on Monday!
Monday, June 09, 2008
Dr. Westman: Yet Another Possible Explanation
After reading the findings comparing the Masai, and the rural and urban Bantu in Tanzania, Dr. Eric Westman penned a reply to the British Journal of Sports Medicine:
Yet another possible explanation
Eric C Westman, researcher Duke University
Thank you for this contemporary assessment of dietary intake among the Masai pastoralists. Through the paradigm-shifting lens of a recent comprehensive summary of the lack of science to implicate saturated fat as a cause for heart disease [1], and new studies which suggest carbohydrate to be more worrisome than saturated fat for atherogenesis [2-4], there is a simple explanation for why the Masai do not develop atherosclerosis despite consuming a high-fat diet that the authors did not consider: high-fat diets (not containing man-made fats) are not atherogenic.
1. Taubes G. Good Calories, Bad Calories. Knopf Publishing, 2007.
2. Krauss RM et al. Separate effects of reduced carbohydrate intake and weight loss on atherogenic dyslipidemia. Am J Clin Nutr 2006;83:1025-31.
3. Mozaffarian D et al. Dietary fats, carbohydrate, and progression of coronary atherosclerosis in postmenopausal women. Am J Clin Nutr 2004;60:1102-3.
4.Volek JS et al. Dietary carbohydrate restriction induces a unique metabolic state positively affecting atherogenic dyslipidemia, fatty acid partitioning, and metabolic syndrome. Prog Lipid Res 2008;Mar 15 (Epub ahead of print]
Saturday, June 07, 2008
Blood Sugar Control Useless?
In what has to be one of the most irresponsible reporting on study data I've ever seen, the New York Times today headlined Tight Rein on Blood Sugar Has No Heart Benefits, penned by Gina Kolata.
Throughout the entire article we find statements without qualification as to how study participants were attempting to lower blood sugars:
Two large studies involving more than 21,000 people found that people with Type 2 diabetes had no reduction in their risk of heart attacks and strokes and no reduction in their death rate if they rigorously controlled their blood sugar levels.
[...]
Thus both studies failed to confirm a dearly held hypothesis that people with Type 2 diabetes could be protected from cardiovascular disease if they strictly controlled their blood sugar.
[...]
Still, said Dr. John Buse, president for medicine and science of the diabetes association, the blood sugar/cardiovascular disease hypothesis has failed for people with established Type 2 diabetes.
For these patients, “intensive management of A1C for cardiovascular risk probably isn’t worth it,” Dr. Buse said.
The two studies both sought to control blood sugars through intensive use of pharmaceuticals - with no control group to compare findings in those utilizing dietary and lifestyle interventions shown to improve blood glucose and HbA1C levels (carbohydrate restriction) with lower levels of medications or no medication.
The blanket statement that the trials " failed to confirm a dearly held hypothesis that people with Type 2 diabetes could be protected from cardiovascular disease if they strictly controlled their blood sugar" leaves out one critical qualification - the sentence should end with "through intensive use of medication."
Thursday, June 05, 2008
More than 50% of Americans Have a Chronic Health Condition!
A sobering finding from a recent Gallop Poll - 51% of Americans suffer with chronic health conditions such as heart disease and diabetes. That's more than half of us!
As noted in the Reuters article, Many Americans Stuggling in Life, Survey Finds, "Healthways President Ben Leedle said 51 percent of Americans are stuck in a cycle of chronic disease such as heart disease and diabetes, in part because of their poor choices. 'Many are stressed, worried and overweight, all factors which lead to illness and, ultimately, lifelong health conditions,' Leedle added."
An alarming 66% of working Americans reported one or more chronic disease or recurring condition, and greater than 20% reported calling in sick at least one day and on average six days in the past month!
What the heck is going on?
We spend more on healthcare than any other nation in the world, have the highest percentage of a population vaccinated, and are unusually obsessed with our health, diets and a variety of health risk markers! Yet more than half the population suffers a chronic disease?
What do you think is happening? Leave your comments!
My Big Fat Diet - Now Available on DVD
In March of this year I posted about a low-carbohydrate diet study, conducted in a small village on Alert Bay in Canada, with those from the area participating in what would be a ground-breaking trial to see the effect of returning to a dietary composition which reflected more traditional ratios of fat, carbohydrate and protein without going back to an absolutely pure traditional diet based on only traditional foods.
As I noted in my post, the findings were "expected" - it was reported that subjects in the study, following the dietary approach:
Lost 10.1% of body weight
Shed 9.7% of their waist circumference
Improved their waist-to-hip ratios significantly
Triglycerides (TG) declined 19.9%
HDL rose 17.4%
TG/HDL ratio improved 30.2%
TC/HDL ratio improved 11.5%
Total Cholesterol (TC) and LDL had no significant change
What's neat about this study is that they didn't just participate and then have researchers follow-up and report the findings - they also filmed a documentary about the study while it was in progress.
That documentary is now available and you can purchase a copy here! (for the record, I have no vested interest in sales of the DVD)
Dogmatic Conclusions to Make Your Head Spin
One of the oft repeated concerns about a carbohydrate restricted, high-fat diet is long-term effects. With globalization and a wide-variety of foods available in even remote locations today, it's increasingly difficult to find traditional populations whom may be ideally suited to assess the long-term effect of such a diet.
One such population does exist - the Masai of Africa - for whom meat, milk and blood are their daily dietary staples, a naturally low-carbohydrate diet that has been traditionally consumed for generations. They offer us a unique opportunity to assess how such a diet impacts the 'health risk markers' held dear in modern science and medicine.
Does their diet, high in fat, make them fat?
Does their diet, high in fat, make them hypertensive?
Does their diet, high in fat, lead to high cholesterol levels?
For decades many have assumed that a diet rich with dietary fat leads to obesity, high blood pressure and high cholesterol, which then is assumed to lead to heart disease and other chronic health problems.
In the June 3, 2008 issue of the British Journal of Sports Medicine a study investigating the Masai and their dietary habits and comparing them with rural and urban Bantu consuming different dietary practices is quite enlightening and tells us a story about how consuming dietary fat per se is not the underlying cause of obesity, high blood pressure or high cholesterol.
In the study published, Daily Energy Expenditure and Cardiovascular Risk in Masai, Rural and Urban Bantu Tanzanians, we learn that researchers investigated the dietary habits of three distinct populations within the same country - Tanzania - thus limiting confounding variables due to vastly different cultural conditions.
In total, the researchers investigated the health and health risk markers of 985 Tanzanian men and women - 130 Masai, 371 rural Bantu and 484 urban Bantu - with each group reporting very different dietary habits.
The Masai reported a high-fat, low-carbohydrate dietary pattern.
The rural Bantu reported a low-fat, high-carbohydrate dietary pattern.
The urban Bantu reported a high-fat, high-carbohydate dietary pattern, similar to a Western diet.
Which group to do think fared best?
BMI (average)
Masai = 20.7
Rural Bantu = 23.2
Urban Bantu = 27.4 (as a whole, the group was, on average, overweight)
Incidence of Obesity (BMI at or higher than 30)
Masai = 3%
Rural Bantu = 12%
Urban Bantu = 34%
Waist-Hip Ratio (lower is better)
Masai = 0.87
Rural Bantu = 0.89
Urban Bantu = 0.93
Blood Pressure
Masai = 118/71
Rural Bantu = 134/80
Urban Bantu = 134/82
Prevalence of Hypertention
Masai = 4%
Rural Bantu = 16%
Urban Bantu = 21%
Total Cholesterol
Masai = 3.89mmol/L (152mg/dl)
Rural Bantu = 3.60mmol/L (140mg/dl)
Urban Bantu = 4.50mmol/L (176mg/dl)
HDL (higher is better)
Masai = 1.08mmol/L (42mg/dl)
Rural Bantu = 0.91mmol/L (36mg/dl)
Urban Bantu = 1.08mmol/L (42mg/dl)
LDL
Masai = 2.09mmol/L (82mg/dl)
Rural Bantu = 2.13mmol/L (83mg/dl)
Urban Bantu = 2.69mmol/L (105mg/dl)
Triglycerides
Masai = 1.36mmol/L (121mg/dl)
Rural Bantu = 1.45mmol/L (129mg/dl)
Urban Bantu = 1.61mmol/L (143mg/dl)
Total Cholesterol/HDL Ratio (less than 4 is 'ideal')
Masai = 3.72
Rural Bantu = 4.38
Urban Bantu = 4.53
LDL/HDL Ratio (the lower the better)
Masai = 2.21
Rural Bantu = 2.46
Urban Bantu = 2.69
ApoB/ApoA-1 Ratio (measure of LDL particle ratios, lower is better)
Masai = 0.74
Rural Bantu = 0.83
Urban Bantu = 0.81
So, there you have the major findings. What did the researchers conclude?
No! It couldn't possibly be their dietary habits, it must be that the "potentially atherogenic diet among the Masai was not reflected in serum lipids and was offset probably by very high energy expenditure levels and low body weight."
Now their level of physical activity certainly may be contributing to their overall health, but it's certainly not independent of their dietary habits. In fact, I would contend that while it's ideal to be active, that is not the driving force in 'health' or lack thereof - it's dietary habits that dominate our health outcomes, our level of activity may be important too, but activity in and of itself is no solution to a piss-poor diet.
We need, before activity, a proper diet to enable us to perform phyisical activity, not the other way around! So while the researchers here could not bring themselves to even consider that the habitual diet of the Masai - high-fat and low-carbohydrate - was the driving force in their good health and enabled high levels of activity, I'll say it!
Here we have evidence that a high-fat, low-carbohydrate diet, consumed habitually does not lead to obesity, high blood pressure and dyslipidemia, and it may, in fact, lead to beneficial long-term health and increased levels of activity in those habitually eating such a diet.
Thursday, May 22, 2008
2010 Dietary Guidelines Committee
From Nutrition & Metabolism Society:
As you probably know, the U.S. Department of Agriculture (USDA) shapes the contents of the food pyramid. They are currently in the process of developing plans for the 2010 Food Pyramid and selecting experts for the committee.
This panel should reasonably include scientists or nutritionists who have experience with diets low in carbohydrates and, understand their impact on health.
In the past, the USDA has not included such researchers on their panels.
We're reaching out to you to ask for your help in communicating to the USDA the importance of including viewpoints like Dr.'s Feinman, Volek, Westman and Lustig on the Dietary Guidelines Advisory Committee. Your encouragement will help ensure that the Committee has a balanced view of diet and nutrition.
Following is a sample template letter to the USDA (Carole.Davis@cnpp.usda.gov). Please customize with your own personal story, (Be sure to cc: NMS info@nmsociety.org and your Congressional Represenative and Senators). The dead line for nominations is May 23 so please take the time to do this now.
Personal stories about results of lowering carbohydrates in your diet will send a powerful message to the USDA. Let them know you have valuable input and a voice that will be heard.
For a list of qualified candidates, please consider NMS Scientific Board Members.
Thank you.
--------------------
Sample Letter
Carole.Davis@cnpp.usda.gov
Nutrition Promotion Staff Director
Co-Executive Secretary of the Dietary Guidelines Advisory Committee
Center for Nutrition Policy and Promotion
US Department of Agriculture
3101 Park Center Drive, Room 1034
Alexandria, VA 22302
Dear Ms. Davis:
I am writing you about the recent announcement about the establishment of the Dietary Guidelines Advisory Committee for the 2010 Food Pyramid. I understand that the selection process is currently underway to determine what voices will be part of the discussion about the framework for the American diet. Some aspects of the current food pyramid are not a reflection of the needs that most Americans like myself have in order to maintain health. I encourage you to ensure that researchers who have performed extensive studies on the benefits of adjusting variables in the diet, like Dr. ___________ be included on the panel.
I have many reasons for wanting to make sure that the panel includes experts on the science behind different kinds of diets, such as diets low in carbohydrates. [insert your own personal story - 1 or 2 paragraphs - about the results you have achieved by lowering the carbohydrates in your diet. Write about how these results have made you feel. What health effects have you seen?]
Facts about the science of low-carb diets are important to the discussion about the new food pyramid. I urge you to make sure the Dietary Guidelines Advisory Committee includes scientists who are well-informed about these issues.
Sincerely,
[Your name]
Cc: www.NMSociety.org
(your senator)
(your congress person)
Wednesday, May 21, 2008
Bragging Rights
Last week, on Friday, my husband was on the front page of our local newspaper, the Columbia Tribune!
In vitro treatment success rate soars at Columbia clinic
In vitro treatment success rate soars at Columbia clinic

In vitro fertilization, once a long shot for couples unable to conceive naturally, is becoming a much better option thanks to new technology, but high costs still prevent some couples from pursuing the treatment.
During a recent interview, Gil Wilshire, endocrinologist at Mid Missouri Reproductive Medicine and Surgery Inc., practically jumped out of his seat when discussing the rate of IVF pregnancies, embryos that were successfully implanted.
"I can’t even believe I’m giving this to you," he said, sliding a piece of paper with his office’s statistics across the desk. "Last month I did five transfers, and four got pregnant. ... That’s incredible."
Last year, Wilshire said, his office broke all internal records. It saw a 44 percent success rate for patients between the ages of 38 and 40 years old and a 67 percent success rate for patients ages 35 to 37. Patients older than 40 were successful 17 percent of the time. Those numbers are significantly higher than the most recent national rates, which are also on the rise. Mid Missouri Reproductive performed 56 total IVF cycles in 2007.
The Missouri Center for Reproductive Medicine and Fertility at Columbia Regional Hospital, the other large fertility clinic in town, had a slow year, with only two pregnancies out of nine IVF cycles. But the center has just completed a move into a $1.4 million renovated fertility clinic at Columbia Regional Hospital, and doctors say they’re expecting a big 2008 and 2009.
"We’ve been a two-site program for the last five or six years," said Danny Schust, one of two endocrinologists at the program. Schust said the laboratory was previously housed at University Hospital and the clinic was at Columbia Regional. "It was disjointed. It really makes no sense," he said. "So we’re excited to have it all together."
There are other reasons for optimism. In vitro fertilization has switched from a simple numbers game, where doctors tried to overwhelm long odds with large numbers of sperm and eggs, to a more precise science.
"Back in the early ’90s, when I did my fellowship in reproductive medicine and endocrinology, a good success rate was 14 percent," Wilshire said. "We were groping in the dark as a profession. We’d put a bunch of embryos up there and pray to God, hopefully the embryos would stick and you’d get a pregnancy in there."
If a couple decides to undergo the costly IVF treatment, doctors first prescribe a drug - gonadotropin - that stimulates ovulation to cause the woman’s body to release multiple eggs. They remove eggs from the woman and place them in a petri dish protected in an incubator. The doctor then has two choices: pour sperm over the egg in hopes that one will make its way in or, in cases of men with low sperm counts, use a "micro manipulator machine" to inject a single healthy sperm into the egg.
Then it’s time for the fertilized egg to grow. One of the most exciting advances of recent years is the "medium" used to replicate the fluid of the womb. This medium - made up of amino acids, sugars and nutrients - has been perfected by scientists to replicate conditions in the womb.
Whereas 10 years ago doctors would have to implant the embryo in the womb after one or two days in the petri dish, they now can wait five days, until the embryo has divided into eight cells and is well on its way to becoming a fetus. "The real advances are in the IVF lab. I wish I could say the doctors are getting better, but I think it’s the embryologists who are getting better," Schust said.
But the doctor’s skill comes next. After five days, he or she must remove one or two of the fertilized eggs and implant them near the top of the womb. Wilshire said when he began practicing, he would put in four or five embryos just to be sure one would take. Today, he says, he rarely puts in more than two.
Wilshire proudly wielded the "coaxial catheter," a thin, rotating pipette used to do the implantation.
"I liken it to fly fishing," he said. "When you’ve got crystal-clear water and you’ve got a big trout in the pool, if you even look in there or drop a stone, it scurries away - it’s very scared and skittish. However, if you’re a good fly fisherman, you’re way away and you cast just right, then the fly goes out and it goes ... down real lightly like a natural fly, and the trout comes up and gets hooked."
None of this is cheap, however. IVF cycles typically cost about $7,000 without medication. Once the medications are included, that figure can rise to $10,000 or more. In Missouri, group health insurance policies are not required to cover IVF, but a bill sponsored by Rep. Steve Hodges, D-East Prairie, would mandate that all policies covering more than 25 employees cover the treatment.
Hodges said he got the idea for legislation after hearing the story of a New Madrid couple who needed help from family members to pay for IVF.
"For people who want a child that badly - and the procedure is fairly taxing, not counting the expense and emotion involved - I just thought, ‘We spend lots of money trying to save lives, why not spend some money trying to create one?’ " Hodges said. "I have a saying: ‘A good thing is always a good thing,’ and I think this is a good thing."
Subscribe to:
Posts (Atom)


